Internet of Conservation
One open map of who conserves what, and where.
The Internet of Conservation connects the organizations, projects, places, species, laws, and data behind conservation into one knowledge graph that every project draws on and every project adds to. It is global in scope: its cyberinfrastructure and AI tools are built for use anywhere. It is being rolled out first with California data, and California is only the starting point.
A corner of the graph today: Putah Creek in Yolo and Solano counties. Select any record to read its links.
Why
Every partnership starts by rebuilding the same inventory.
Conservation everywhere depends on many hands: agencies, land trusts, water districts, universities, and community groups. Each holds part of the picture: who manages which lands, which projects are under way, which species they protect, which laws and plans apply, and what data exist. That knowledge sits in separate spreadsheets, reports, and websites that do not talk to each other.
The cost is real. Each new partnership, regional plan, or grant spends its first months rebuilding the same inventory, and the inventory usually ends with the grant. Funders cannot see where investments overlap or where the gaps are. Practitioners cannot find who else works on the same species or stream.
The Internet of Conservation gives conservation knowledge what the internet gave computers: a common way to connect.
Like a road network, it is infrastructure. No single project can justify building it, and every project is better off once it exists.
How it works
A knowledge graph, built in four layers.
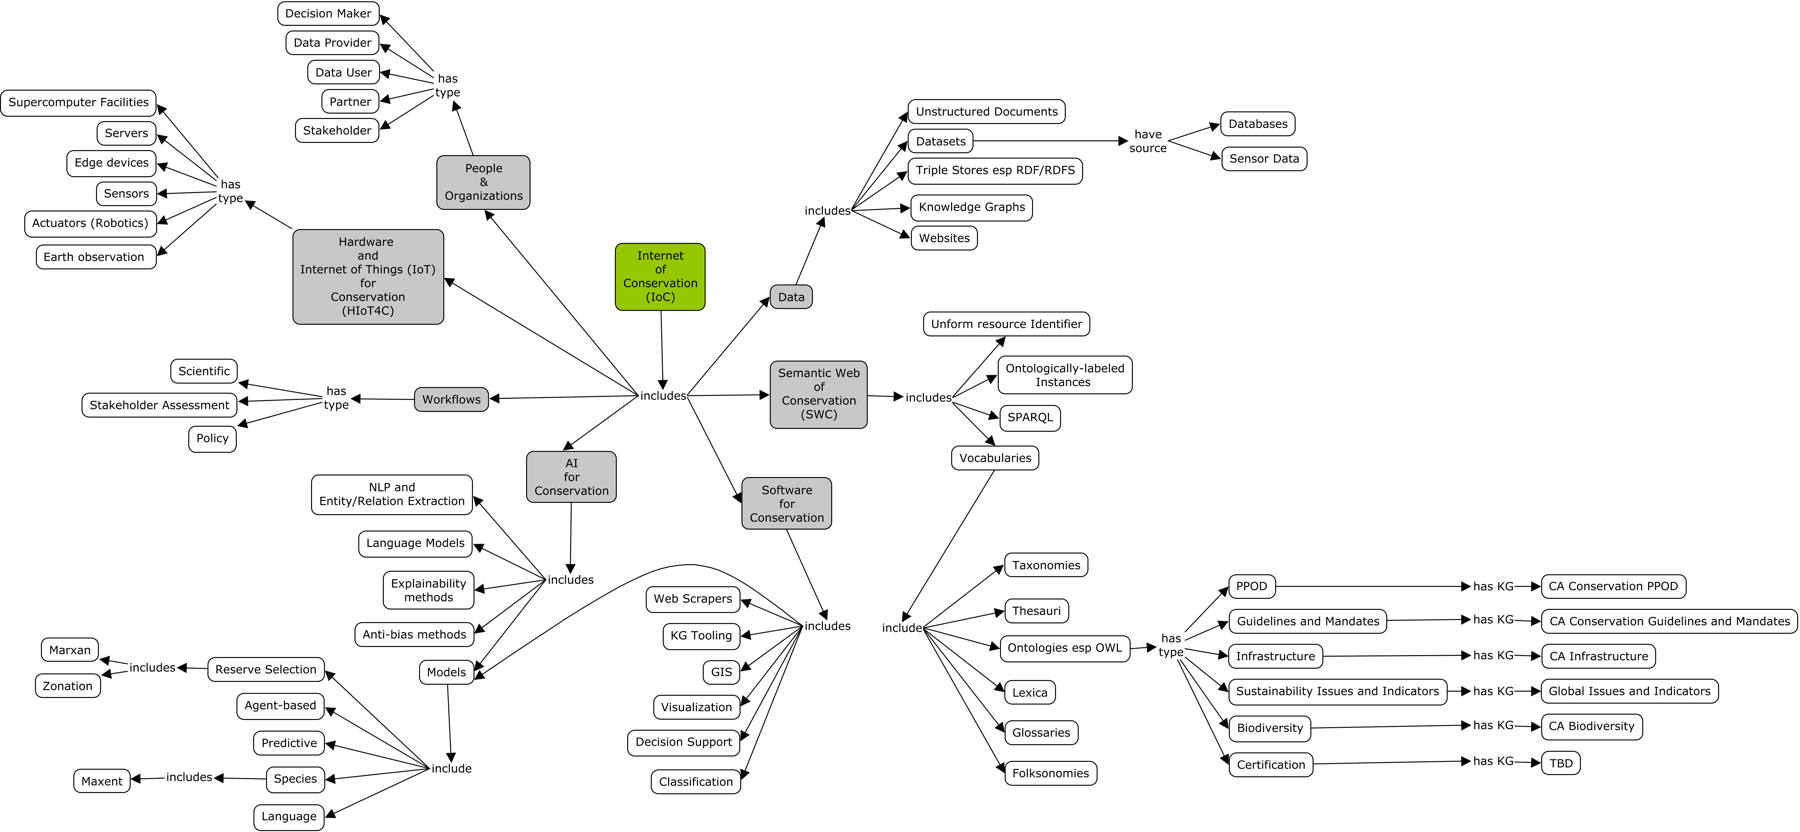
Every organization, project, place, species, dataset, and law is a record, and every relationship between them is a labeled link: this project is led by that land trust; this refuge is habitat for that species.
-
Layer 1
Information sources
Partner spreadsheets are read as they are, and public sources are added. The California rollout, for example, draws on protected lands (CPAD), rare species (CNDDB, NatureServe), state data catalogs (CDFW BIOS, California Nature), Wikidata, and web pages. These are examples only: each region brings its own sources, and the list grows as the IoC develops.
-
Layer 2
The knowledge graph
Everything is translated into one common vocabulary. Datasets follow the international Dublin Core and DCAT standards. Every fact notes its source and every change is logged. The graph also works out facts that follow from others (a funder of a wildfire project addresses wildfire) and shows why.
-
Layer 3
Shared tools
Explore and search the map, or ask in plain English (“Which organizations address wildfire through work they fund?”) and see the facts behind each answer. Partners propose changes and editors review them. An AI assistant drafts records from web pages, and a person approves each one.
-
Layer 4
Projects and communities
Each partnership gets its own view of the same graph: its records, places, and issues, with the whole graph behind them. A new project starts from everything already known and leaves the map richer for the next.
What makes it different
Built to last, built to be checked.
Outlasts any one grant
One shared layer serves many projects, so knowledge accumulates instead of starting over.
Sourced and reviewed
Every fact names its source. Every addition is reviewed. AI proposes; people decide.
Explainable
Every answer and every inferred link shows the facts behind it.
Graph plus maps
CBI’s Data Basin joins the graph to geospatial capacity: maps and analyses for its places, projects, and species.
Open
Built on open-source software and open data standards. Everything can be exported.
Careful with people
Names are shown. Contact details are never published, and automated tests enforce it.
Where it stands
A working system, not a plan.
Work to date has been in California: statewide, with depth in the Putah Creek watershed and the Sacramento Valley. Nothing in the design is specific to California, and the same system can serve any region in the world.
- Places and infrastructure
- 6,249
- Organizations
- 4,081
- People
- 1,129
- Projects and programs
- 5,568 / 527
- Conservation plans and their actions
- 166 / 12,627
- Species and other taxa
- 1,014
- Datasets and databases
- 510
- Tools
- 126
- Guidelines and mandates
- 280
- Papers and reports
- 283
- Links between records
- 340,878
Counted from the graph on 28 October 2026. The numbers grow daily. Links come in 98 kinds.
In place today
- Three partner views: Putah Creek Watershed Network, Power in Nature Sacramento Valley, and California Connectivity.
- A graph explorer with search, plain-English questions, and explained answers.
- Editing with accounts and roles, a review queue for proposed changes, and a full change history.
- People’s affiliations and roles in organizations, projects, and programs.
- AI-assisted record entry from a web page, Excel and PDF reports, and a user manual.
Next
- Public hosting with secure sign-in for partners.
- Onboarding contributors from partner organizations.
- Proposed analysis workflows: from a question to the data and tools that can answer it.
- Communities beyond California, anywhere in the world.
Partners
Who is building it.
ICON
Information for the Conservation of Nature. Leads the Internet of Conservation: its vision, vocabulary, software, and partnerships.
Conservation Biology Institute
Geospatial partner through Data Basin, and fiscal sponsor while the IoC forms its own nonprofit.
Community partners include the Putah Creek Watershed Network and Power in Nature in the Sacramento Valley. More major partners are expected as the IoC develops.